VISUALIZING CLIMATE DATA: ECOSYSTEMS
An editorial about rising temperatures in Washington's Snake River and their impact on local communities and ecosystems.


OVERVIEW
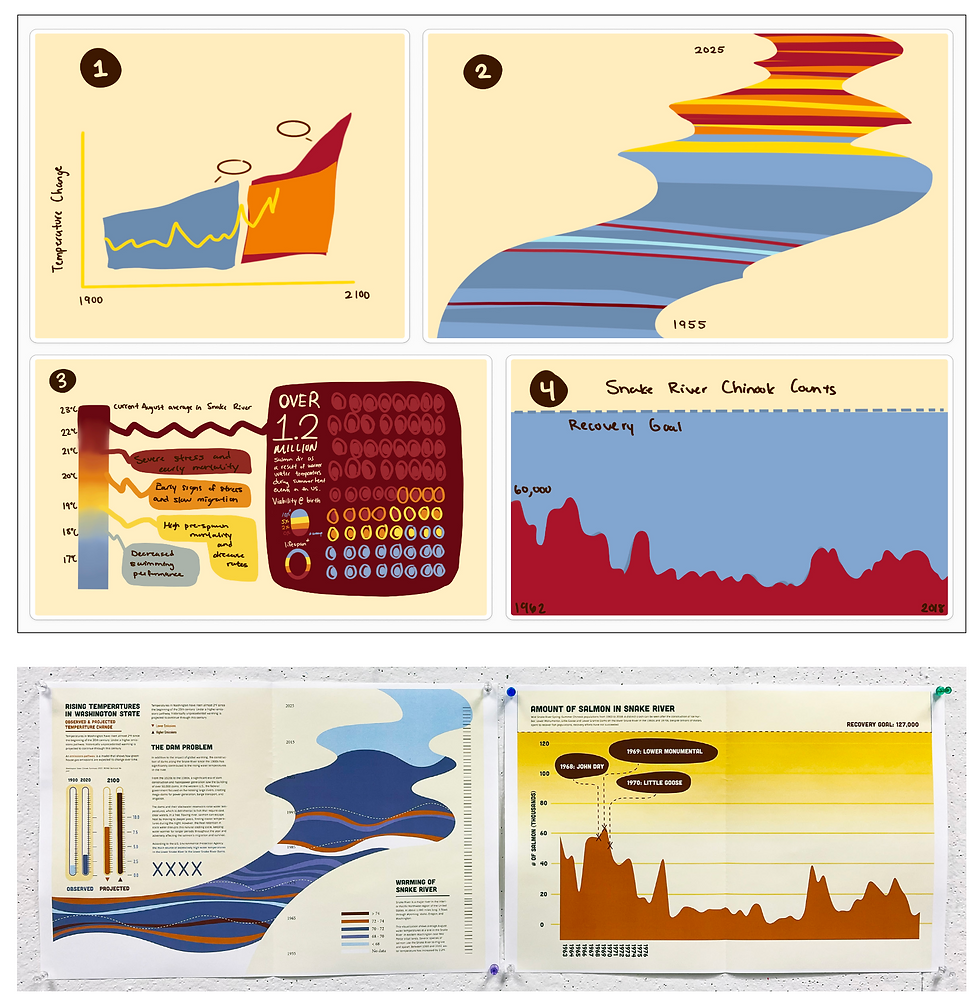
Global rising temperatures are affecting ecosystems and communities all around the world. For this project, I focused on an article from the EPA website, “Tribal Connection: Trends in Stream Temperature in the Snake River,” and chose the data set “Average August Temperature in the Snake River, 1960–2022” to base a series of data visualizations on. These visualizations were then formatted into an editorial insert.
Duration
Oct 2024 – Nov 2024
(3 weeks)
Skills
Layout
Typesetting
Class
Word & Image II
RESEARCH
DATA & FIELD RESEARCH
First, I did a close-reading of my chosen article in order to identify key points and determine what further information I wanted to include in my editorial content. I also began to construct an overall narrative for the editorial.
Then, I conducted field research by looking at existing data visualizations. Through this, I found that I was more drawn to visualizations that employed texture and illustration, as well as realized how important a clear data key is for understanding data.

MIND MAP
After conducting further research, I planned out the flow and pacing of my editorial content with a mind map. The three spreads would cover the following content, in order:
-
Rising temperatures in Washington
-
Rising temperatures in Snake River
-
How this affects salmon
-
Impact of salmon population decline on ecosystems and communities
-
Call to action
I also collected additional data sources to illustrate my different key points.

IMAGE RESEARCH
CONTEXTUAL & DESIGN
When finding inspiration for the visual language of the editorial, I focused on two aspects: context and design.
For contextual research, I found examples of visualizations that displayed multiple data sets at once. I enjoyed the visual rhythm of dense sections of text broken up by larger blocks of color.
For design research, I gathered images pertaining to Snake River and to the Nez Perce tribe. I wanted to incorporate the river's curve into my design as well as the tribe's traditional patterns and colors of reds and blues.
In the end, this research helped me establish a visual language for the editorial that used a vibrant red and blue color palette with organic shapes, and a mixture of solid and dotted lines.


PROCESS
The process consisted of several sessions of research, experimentation, and feedback from peers and faculty. You can view and download the entire process book here.
DRAFTING
-
In order to maintain a more organic feel to the editorial, I started brainstorming by sketching out data visualization ideas on the iPad for each chosen data set. Then, I digitized these ideas and began incorporating editorial elements such as descriptions and labels.
REFINEMENT
-
To refine my design system and balance out the visual weight of each spread, I decided to combine an info card that was originally intended to be separate from the spread with the existing middle spread. This move made it possible to fit more info onto less material, as well as prevented there from being a large amount of unused space on the spread.


FINAL SPREADS


